


Scheduled Reporting functionality comes to the GSM management console and now provides the rich and detailed reporting so key to understanding the true health and performance of multiple locations and sites(s). With these new highly granular reporting tools at Administrators’ disposal they can now report more of the information needed and provide a clearer understanding of the endpoints under management. Also as part of this release Windows 10 becomes a searchable OS.
NEW – Scheduled Reporting – Scheduled, customized, granular endpoint reporting may now be run at recurring time periods, or ad-hoc, with the content tailored to the recipient(s) requirements. Internally this means you’ll have greater visibility over your deployment(s) and that both you and your (internal and external) customers will never miss the information important to them.
NEW – Windows 10 OS is now a searchable OS within Group Management giving better visibility of any Windows 10 endpoints deployed.
1. Scheduled Reporting
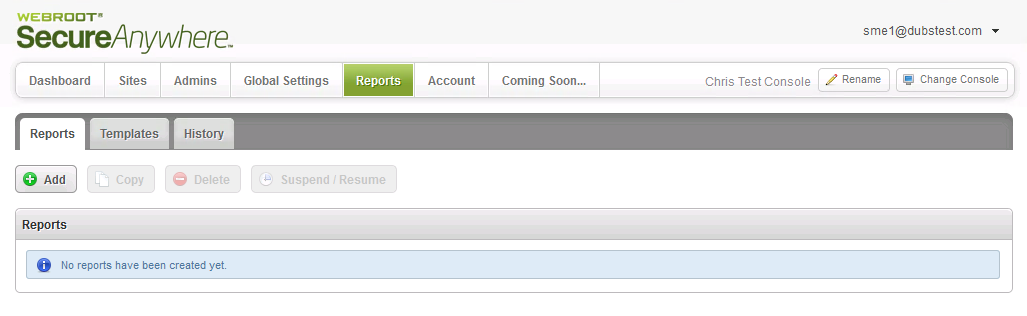
This is the new Scheduled Reporting start screen:
1.1 Create Report Templates
Scheduled Reporting uses a customized template approach. You can start with the Default Report templates provided that are easily copied and modified, or create your own Templates. Either way, you easily add or remove reporting pages, and select the data and time period(s) you wish to include in your report(s).
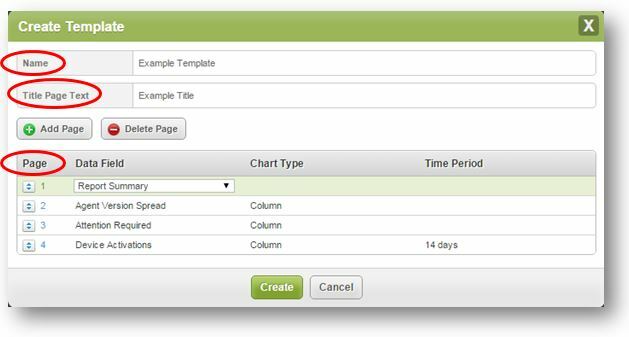
Fig 2 - Create Report Template
Name - Lets you name the template for easy differentiation from other templates, e.g., “LA Managed by Policy Template”
Title Page Text - Lets you customize the text that will appear on the cover of the PDF Report “Policy and Status – LA Sites”
Page - The Create Template area is where the Administrator defines how many pages should be included, which data fields should appear on each page, and the page ordering.
Each row “Page” table allows you to select which data field should appear, which chart type should be used to display the data and the applicable time period that should be used. The Administrator may also add or delete as many pages as they wish using the ‘Add’ and ‘Delete Page’ buttons and re-order the pages as necessary by dragging the rows up and down.
The Create a Template data point report options are listed here:
Data (Point) Field
Chart Types Available
Time Period(s)
Agent Version Spread
Bar, Column, Pie
Attention Required
Bar, Column, Pie
Device Activations
Area, Area Spline, Bar, Column, Line, Spline
24h, 1 day, 2 days, 3 days, 7 days, 14 days,
30 days, 60 days, 90 days
Device Type
Bar, Column, Pie
Endpoint Status
Bar, Column, Pie
Expired Status
Bar, Column, Pie
Firewall Status
Bar, Column, Pie
Identity Shield Status
Bar, Column, Pie
Infrared Status
Bar, Column, Pie
Installation Status
Bar, Column, Pie
Managed by Policy
Bar, Column, Pie
Offline Shield Status
Bar, Column, Pie
Operating System Firewall Status
Bar, Column, Pie
Operating System Language
Bar, Column, Pie
Operating System Platform
Bar, Column, Pie
Phishing Shield Status
Bar, Column, Pie
Primary Browser
Bar, Column, Pie
Real-time Shield Status
Bar, Column, Pie
Remediation Status
Bar, Column, Pie
Report Summary
Bar, Column, Pie
See below
Rootkit Shield Status
Bar, Column, Pie
Scheduled Scans Status
Bar, Column, Pie
Silent Mode
Bar, Column, Pie
Threat detection History
Area, Area Spline, Bar, Column, Line, Spline
24h, 1 day, 2 days, 3 days, 7 days, 14 days,
30 days, 60 days, 90 days
USB Shield Status
Bar, Column, Pie
Virtual Machine
Bar, Column, Pie
Web Threat Shield Status
Bar, Column, Pie
Report Summary listed above is able to provide a number of overall counts that effectively summarize site and deployment information. These summaries include:
- Number of active devices
- Number of available seats
- Endpoints currently needing attention
- Endpoints which encountered threats (Last ‘n’ days)
- Total Threats seen (Last ‘n’ days)
- Number of Endpoints Seen (Last ‘n’ days)
- Number of Endpoints Not Seen (Last ‘n’ days)
- Number of Endpoints Seen (All Time)
- Total Number of Sites
- Active sites
- Trial Sites
- Suspended sites
- Deactivated sites
- Expired sites
- Sites expiring in the next 14 days
- Sites with endpoints needing attention
1.2 Create Reports
After creating the template the Create Report area provides an intuitive way of building, scheduling, distributing and localizing your report(s) as it breaks the tasks down into logical steps and uses drop down selection of the reporting criteria.
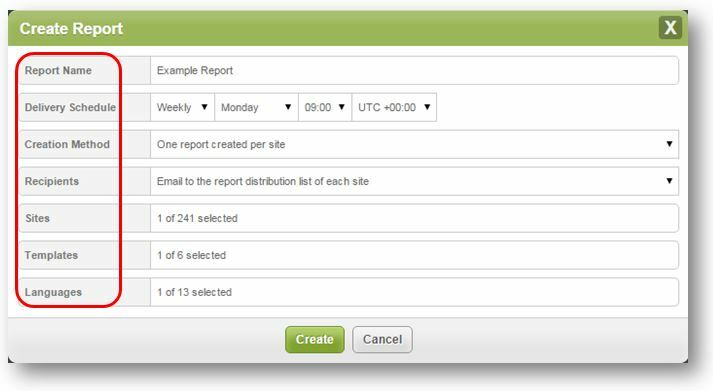
Fig 3 - Create Report Builder
Report Name - Let’s the Administrator create a name to identify and differentiate each report, e.g., “Weekly Summary Report”
Delivery Schedule - Creates a schedule at which to run the report so it is able to be distributed in a timely fashion. The run report schedule options are:
- Daily, specifying a time.
- Weekly, specifying a day and time.
- Monthly, specifying a date and time.
Creation Method - Creates reports to deliver the information to targeted recipients either as an aggregate of selected sites from your deployment, or on an individual site basis. The options are:
- Create one report for each selected site.
- Create one report containing combined data from all selected sites.
- Mail to the Report Distribution List of each site.
- Mail to Static Email Addresses provided manually, or
- Mail to both of the options above.
Sites - The sites to be included in the report.
Templates - The data template(s) to be included in the report
Languages - The languages for the reports to be created in. Any default text, such as graph axes and chart titles will be provided in the selected language. If multiple languages are selected, then one report per language will be created. The options are:
- German, English, Spanish, French, Italian, Japanese, Korean, Dutch, Portuguese, Russian, Chinese (Simplified), Chinese (Traditional) and Turkish.
1.3 Editing Existing Reports
Editing an existing report is a fast way to save time and effort when creating a new report or adjusting an existing one.
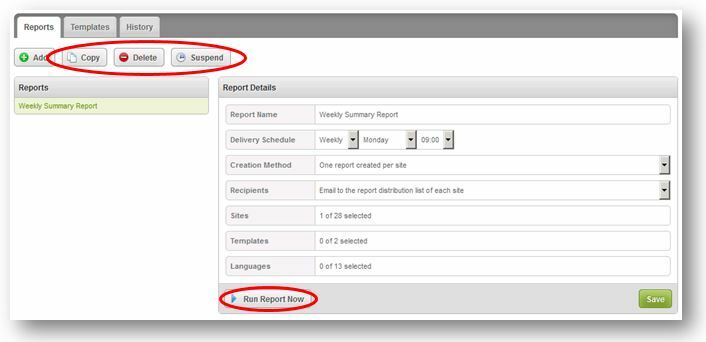
Fig 4 – Editing an Existing Report
Copy - Copying a report is a quick way to create a new report from a similar existing report. Simply select the report to be copied, select “Copy”, and rename the new report. This will cause the new report name to immediately appear in your report list.
Delete - The delete option is available for all reports, and will delete this ‘Weekly Summary Report’ completely.
Suspend/Resume - The suspend option prevents a report from executing on its set schedule without the need to delete it. The schedule may then be resumed at any time. The resume option then becomes available when you select any suspended report from the report list, and will restart the PDF Report creation according to the pre-defined schedule.
1.4 Run Report Now
At any time you can access a report outside of the set schedule by using the “Run Report Now”. This option provides instant reporting coupled to the ability to apply one-off overrides to the report creation method and its distribution list. Clicking on the ‘Run Report Now’ button will bring up the following reporting criterial:
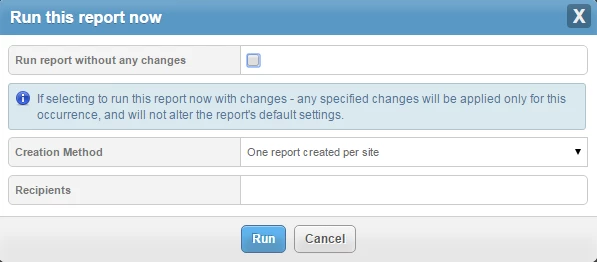
Fig 5 – Run Report Now
With ‘Run Report Now’ you can change the report to provide aggregate information across sites, or report on individual sites and then also customise the recipients – all without causing any permanent changes to the current scheduling. Alternatively, just run the report as is, just as it would have been run when scheduled.
1.5 Report History
This makes it easy to access a historical record of all the reports run over the last 90 days, including the when requested date, recipient summary, and ability to download exactly what was sent as part of the schedule.
Requesting a download will allow you to select from the templates, sites and languages which were included in the original report creation criteria so you can see exactly what was sent to the stakeholders on the distribution list.
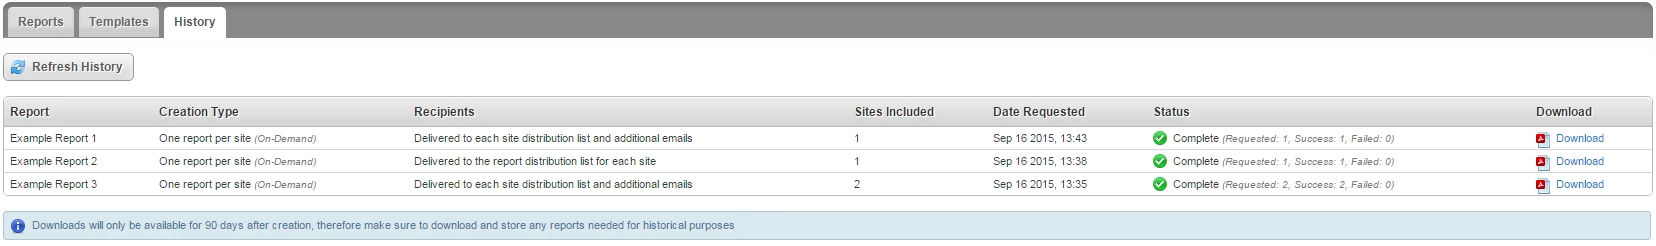
Fig 6 – Report History
Note: Reports are available in PDF format only. Reports are available through Report History for download for a period of 90 days. However, and links provided in emails to download these reports are ONLY VALID for 48 hours.
- Windows 10 OS Searches
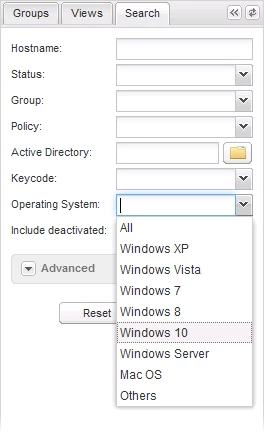
Fig 7 –Windows 10 OS Search
- Additional Changes
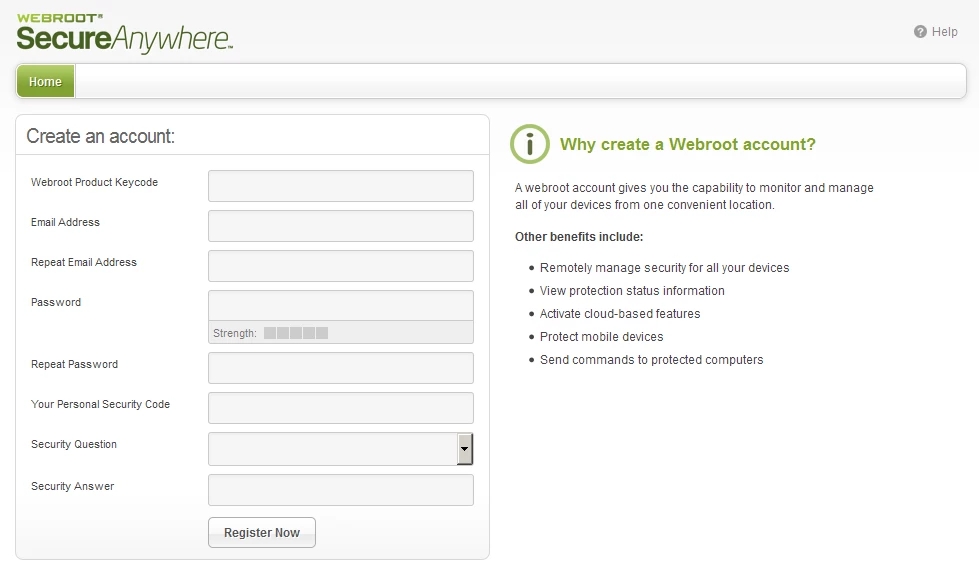
Fig 8 – Why Create a Webroot Account Inform