

Slow scans


Using the latest webroot V9.0.26.61 on my windows 7 pc. With the latest version scans are now taking about 19 mins. I submitted a support ticket last week. I uploaded logs as requested on thursday and as I had not recieved any response to confirm they had been recieved I contacted weboot. I spoke to a representative this afternoon who said the logs where being analysed and I would recieve a response either today or tomorrow. Just a few momments ago I got a response saying they had not recieved the logs and could i send them again. What is going on? I have replied and sent the logs a second time. Not very good customer service!
This topic has been closed for comments
Page 1 / 2

Userlevel 7
 +63
+63
Hi @stevecosta
Have you tried a clean reinstall of WSA? If you want to here are the instructions.
Please follow the steps closely!
Thanks,
Have you tried a clean reinstall of WSA? If you want to here are the instructions.
Please follow the steps closely!
- Make sure you have a copy of your 20 Character Alphanumeric Keycode! Example: SA69-AAAA-A783-DE78-XXXX
- Be sure you add your Keycode to your Online Console: Webroot SecureAnywhere Online Console
- KEEP the computer online for Uninstall and Reinstall to make sure it works correctly
- Download a Copy Here (Best Buy Geek Squad Subscription PC users click HERE) Let us know if it is the Mac version you need
- Uninstall WSA and Reboot
- Check for the WRData Folder located here: C:\ProgramData\WRData and if it's there delete it before reinstalling
- Install with the new installer, enter your Keycode and DO NOT import any old settings as you can set it up as you like once it's done
- Let it finish it's install scan
- Reboot once again
Thanks,
Userlevel 7
+63
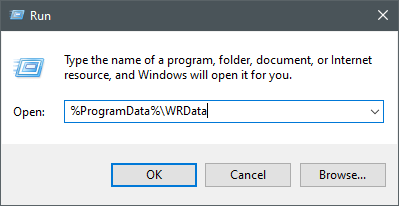
If you can't see that Hidden Folder this is the easiest way to get there via the RUN Command.
%ProgramData%\WRData
%ProgramData%\WRData
Userlevel 7
+63
I use this to upload and share: https://www.myairbridge.com/en/#!/home
Thanks for the replies. I did a complete uninstall including the WRdata file but my scan is still taking almost 20 mins. I have reuploaded the log files again and just had a prompt response to say they have been recieved and looked at. Just need to be patient for the outcome.
Userlevel 7
+63
Your the second person that I know that has long scan issues.
My 2 windows 10 laptops scan in about 4 mins total . The problem of the long scan time of 19mins is just on my Windows 7 Home PC. When i do a scan it gets upto 40% in 2 mins than takes another 18 to complete. Towards the end it really slows and says performing system analasys which it does not appear to do on my other Windows 10 laptops.
Userlevel 7
Third person
Userlevel 7
+63
Very interesting....not and support needs to escalate this so maybe Lucas @TechToc can tell us what's going on?
My Win 10 build 1903 nice and fast.
My Win 10 build 1903 nice and fast.

Userlevel 5
 +16
+16
I'm looking at the logs now, and while I can see three scans, historically. All over 20 minutes, the first scan included three detection's as well. I'm not seeing a quarantine DB, which suggests that you manually overrode these files. This can have an impact on interrogations of files lengthening the scan since the system thinks it's still potentially infected. If these files were FP's please let us know, and we can correct the determinations.
System events provide the following messages as well:
Disk 7 Error None Stephen-PC The device \Device\Harddisk0\DR0 has a bad block.
further performance hits are likely due to this message:
Microsoft-Windows-Kernel-Processor-Power 6 - Some processor performance power management features have been disabled due to a known firmware problem. Check with the computer manufacturer for updated firmware.
This suggests that the system isn't operating at peak performance. More information on this message can be found here:
https://social.technet.microsoft.com/wiki/contents/articles/3565.event-id-6-microsoft-windows-kernel-processor-power.aspx
While it's possible that any of these issues could cause longer than average scans, the fact that we see all three combined go some ways to explain the issues here. I'd consider looking into the disk and CPU settings, as well as the detection.
Thanks,
Lucas Moore
Webroot Sr. Global Escalation Manager
Hi Lucas,
Thanks for the reply. The 3 files detected files are false positives and have been allowed by myself. They have been on my PC for years with no problems in the past. These files are on my Windows 10 laptops and they scan very fast. Surely if they are allowed it should not affect the scan speed. I have the latest bios firmware. I have run performance troubleshooter, SFCscan & dskchk. Can the false positives please be removed.
Thanks for the reply. The 3 files detected files are false positives and have been allowed by myself. They have been on my PC for years with no problems in the past. These files are on my Windows 10 laptops and they scan very fast. Surely if they are allowed it should not affect the scan speed. I have the latest bios firmware. I have run performance troubleshooter, SFCscan & dskchk. Can the false positives please be removed.
Hi,
Today performed performance trubleshooter, dskchk & SFC scan. I have reinstalled the older V9.0.24.49 and now my PC scan only takes 5m 31s.
When I update to the latest V9.0.26.61 the scan takes 19m.
Surely this must be an issue with the latest update!
Today performed performance trubleshooter, dskchk & SFC scan. I have reinstalled the older V9.0.24.49 and now my PC scan only takes 5m 31s.
When I update to the latest V9.0.26.61 the scan takes 19m.
Surely this must be an issue with the latest update!
Userlevel 5
+16
There are a number of changes in the .26.61 build that may have an impact on performance, when coupled with older hardware. I expect this to be the contributing factor in this case.


Me too ... I got smacked down by V9.0.26.61 exactly like the OP when I was auto-updated from V9.0.24.49 two days ago. Identical slow manual scans just like the OP described. It hit my old rarely used WinXP unit first. Then hit my Win7 unit next (just after I started a new thread about my XP unit).
I contacted Support and they promptly replied with advice to download, execute and return the results from wsalogs.exe which I shall do.
In the meantime, I'll will wait and follow this thead. I did start another topic found at the link below which now seems redundant so maybe our Moderators can move my posting over here?
https://community.webroot.com/home-product-releases-27/01july2019-auto-update-to-9-0-26-61-on-winxp-manual-scans-now-take-5-times-longer-339372#post346275
BTW ... how do I subscribe to this thread for notices of replies, etc .... Thanks a million everyone!
Is there any way to go back to V9.0.24.49 and hang out there w/o being updated to V9.0.26.61 whilst things get sorted out over the next week or so?
Userlevel 5
+16
HI @RRod ,
I've pulled the case, and the logs from the XP machine. Have you ran the utility for the Windows 7 machine?
Lucas
I've pulled the case, and the logs from the XP machine. Have you ran the utility for the Windows 7 machine?
Lucas
Hi @TechToc ,
Unfortunately Lucas, my wife currently has the Win7 ThinkPad and will be staying with her family out of town for another week. I returned home early after the 4th due to work commitments.
I'll try to ask her to pull logs but she may be reluctant due to being "less" than non-tech savvy (if such a level is even possible). As a non-smartphone person in her early-sixties, she always worries about messing something up, especially when she's away from home w/o me there physically to help.
I will pull logs from the Win7 ThinkPad upon her return in the worst case senario.
BTW, Is there any way to go back to V9.0.24.49 for the time being w/o being auto-updated?
Our Win10 ThinkPad is unaffected .... Thanks for your investigation and help.
Userlevel 5
+16
Thanks,
Lucas
My computer has been running slow and tonight froze and was almost crippled. I checked task manager and my cpu was running at 100%. I have shutdown webroot and my pc is back to normal. There is a problem with the latest version with slow scan speeds and excessive cpu usage. Feel fobbed off as support say there is no problem with the latest update.
Userlevel 5
+16
I did reinstall the older version and it worked fine but reupdated to the latest version again. Will the new version be resolved or should I go back to the older version V9.024.49 again. Just concerned about using the old version and protection. Will the old version always remain working?
Userlevel 5
+16
With a small number of exceptions in the past, a build once published is code complete and will not change. That is to say 9.0.24.49 will always be 9.0.24.49, 9.0.26.61 will remain the same. The next release will build on the code base established in 9.0.26.61 adding bug fixes that presented in that build, and adding any new features.
As for protections, the cloud determinations are universal between all versions. In the case between 24.49 and 26.61 not much was changed from a security perspective. There were some additions related to script shield. But this was just the groundwork for that shield, with more being implemented in later releases. Your logs indicated high CPU usage as well, which also informed my conclusion.
As for protections, the cloud determinations are universal between all versions. In the case between 24.49 and 26.61 not much was changed from a security perspective. There were some additions related to script shield. But this was just the groundwork for that shield, with more being implemented in later releases. Your logs indicated high CPU usage as well, which also informed my conclusion.

 +1
+1
Hi,
I have also been experiencing slow scans probably for the past 7 to 10 days. I'm guessing it has to do with Software Version 9.0.26.61. Daily scans used to take 5 minutes and now are taking 30 minutes. It stays in "Performing Central Analysis" for a long time. It's a Windows XP machine but it's got a Core 2 Quad CPU Q8200 @ 2.33GHz with 2.00GB of RAM. There haven't been any known changes in my PC's configuration. No new programs, no new hardware, etc.
I haven't tried uninstalling/reinstalling but I did uncheck the box under Advanced Settings > Scan Settings > Allow files to be submitted for threat research. This made no difference in scan time.
Hopefully, a resolution to this recent slow scan issue can be resolved in a new Software release.
Regards,
creakndale
Userlevel 5
+16
+1
TechToc,
I've attempted to gather more information on the slow scan issue by watching the Webroot progress bar, CPU and Memory usage.
Prior to starting the scan, average CPU Usage is 0%. All 4 Cores are at 0%. Page File Usage History indicates 324MB.
As I start the scan, the "Files Scanned" is incrementing rapidly and the Progress bar is moving quickly. Webroot Processes = 31 (1,356 Modules). Looking at CPU Usage history, during this time 3 Cores are at ~1% and one Core is running ~90%. Average CPU Usage is 25% to 29%. Page File Usage History indicates 385MB.
At 1m 44s with 8143 Files scanned and the Progress bar at 41%, the scan slows dramatically. Files scanned increments very slowly. At this time, the 3 Cores that were at 1% jump to ~20% and the one Core that was running at 90% drops to ~50%. Average CPU Usage is the same at 25% to 29%.
At 7m 42s the Progress bar moves to 42% with 8382 Files scanned. Average CPU Usage is the same at 25% to 29%.
At 10m 5s the Progress bar moves to 43% with 9214 Files scanned. Average CPU Usage is the same at 25% to 29%.
At 12m 45s the Progress bar JUMPS to 99% with 9516 Files scanned and shows "Performing Central Analysis..." Average CPU Usage is the same at 25% to 29%. Page File Usage History indicates 402MB.
At 28m 30s average CPU Usage jumps to 55% and Files scanned is incrementing rapidly. Page File Usage History jumps to 550MB.
At 29m 20s the scan completes with 56,141 Files scanned. It had been in "Performing Central Analysis..." for 16m 35s.
With the scan complete, average CPU Usage drops to 0%. Page File Usage History drops to 350MB.
creakndale
Page 1 / 2
Login to the community
No account yet? Create an account
Enter your username or e-mail address. We'll send you an e-mail with instructions to reset your password.